Unite Dashboard For Nagios MonitoringUnite Dashboard For Nagios Monitoring
Consolidated Dashboard for multiple Nagios and monitor all servers status in single window.Unite Dashboard For Nagios Monitoring
Consolidated Dashboard for multiple Nagios and monitor all servers status in single window.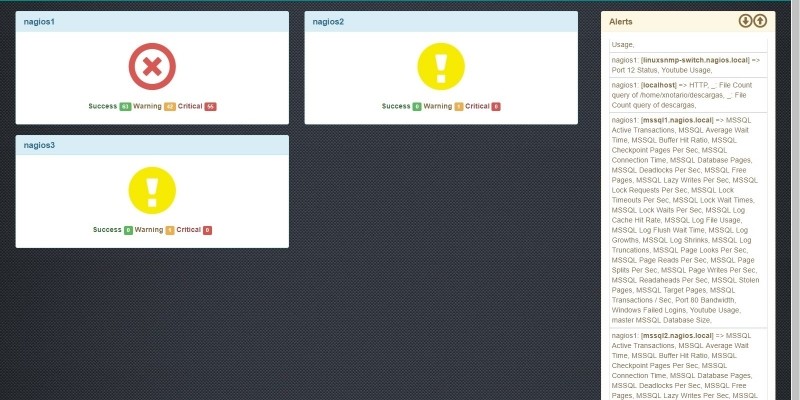
Screenshots


Overview
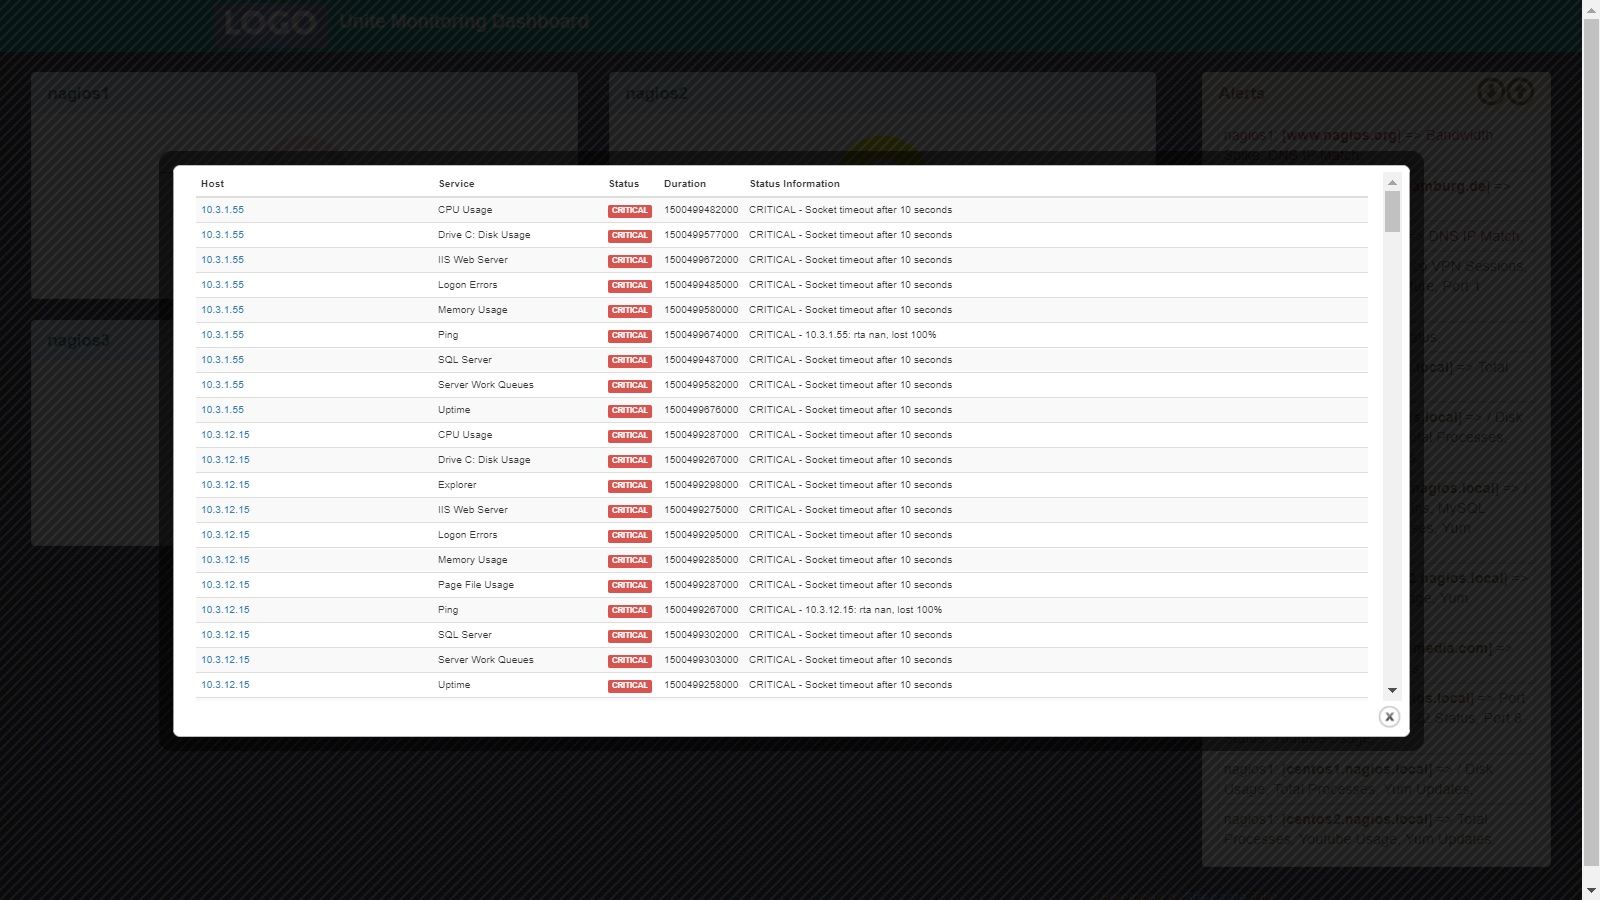
Unite Dashboard will combine multiple Nagios into single dashboard. You can easily monitor multiple Nagios dashboard in single window.
Features
- Support multiple Nagios Application and display all servers status in single window.
- Shows number of up/down/warning hosts.
- Audio alert for any change in the service status.
- Responsive design.
- Easy to customize.
Requirements
- Apache
- PHP >= 5.3
- Nagios Core Version >= 4.1.1
Instructions
1. Open config.php file and update/add nagios url, username and password
2. Test the nagios API URL to check wheather you are able to get json data in http://example.com/cgi-bin/statusjson.cgi?query=servicelist"
More info at:
https://www.nagios.org/news/20...
https://www.slideshare.net/nag...
3. Access the page using http://example.com/Nagios-Unit...
Enjoy...
Information
| Category | Scripts & Code / PHP Scripts / Miscellaneous |
| First release | 14 July 2017 |
| Last update | 24 July 2017 |
| Files included | .php, .css, .html, .swf/.flv, Javascript .js |
| Software version | PHP 5.3, PHP 5.4, PHP 5.5, PHP 5.6 |
| Tags | dashboard, monitoring |